GeoSpatial Widgets
2006-2008
Participants
Gary Priestnall
Jack March
Funding
Visual Learning Lab (HEFCE-funded) 
Project Overview
The word ‘widget’ has been used to describe a discrete interactive learning object designed to explore certain spatial and logic skills visually. Examples developed by Jack March and Ed Lester using Macromedia Shockwave 3D are already being deployed in a range of engineering and scientific teaching and learning contexts. The ‘GeoSpatial Widgets’ project aims utilise the same interactive visual framework in a more overtly geographical context. This will produce several new exemplars of ‘visual learning’ illustrating how several interactive graphical techniques can be applied across a range of disciplines. It will also provide some examples of where the Visual Learning Lab and the SPLINT (SPatial Literacy IN Teaching) CETL’s have a common interest. Applications currently under development include: an orienteering application looking at the association of 3D visualisation of a landscape with various 2D map equivalents; and a flood simulator using a Digital Terrain Model (DTM) to model water flow through a catchment.
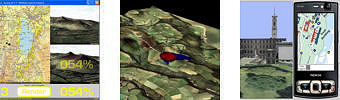
The most well developed application is Locata, an interactive web-based spatial skills test which explores the ability of students to associate 3D landscape views with a 2D map equivalent. 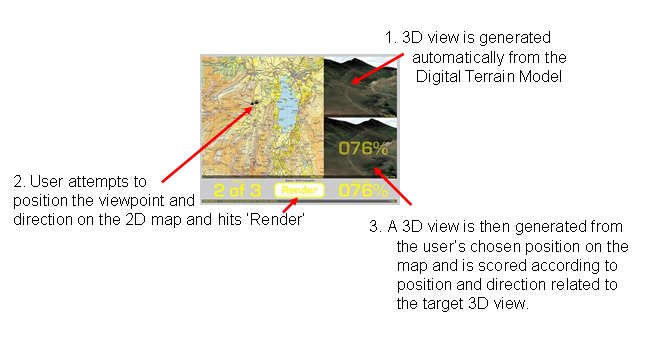
The extract from the British Mountain Map: The Lake District used with permission - Harveys © 2008
Web-based statistics will gathered from student use of this application along with a rolling high-score table. This application is to be deployed during 2007-2008 to accomany a lecture on the new ‘Digital Earth’ module in the School of Geography. In this context it serves as a pre-fieldtrip orientation device as this cohort of students visitis the same area (around Keswick, Cumbria, England) at Easter, during the same semester.
A version of the application has been developed to allow photographs (present day or historic), landscape sketches, or landscape paintings, produced from known locations in the landscape, to be used as the target views shown the top right of the interface. Finally a configurable version has been created to allow many different terrains, and views, to be loaded and explored.
Research Outcomes
Priestnall, G. and March, J. (2008) Learning to read the landscape: Interactive visual tools for exploring spatial thinking. Geographical Information Science Research UK (GISRUK) Conference, 2 - 4 April 2008, Manchester Metropolitan University
Related Links
Project Page [under construction]
Visual Learning Lab
|