Coastal Dynamics and Engineering Research Team

Coastal Dynamics and Engineering

The group focuses on two main areas of research:

  • the evolution of natural and engineered beaches
  • the design of coastal defence structures

The group provides theoretical and numerical tools to predict the impact of water waves on natural and engineered beaches.

Coastal Dynamics
 

Key contacts

Research

Coastal areas are vital for human life and economic well-being. Coastal flooding and erosion are two global issues that threaten these areas. The researchers in the Coastal Dynamics and Engineering group, which was formed in 2010, are pursuing a number of lines of research pertinent to these topics, with a particular emphasis on beach morphodynamics, wave overtopping and wave propagation.

Much of the work aims to develop models that can aid in understanding hydrodynamics and morphodynamics, and which can also be used to predict beach response and aid structural design.

Research areas

Numerical modelling of morphodynamics of natural and engineered beaches

  • Swash zone beachface evolution
  • Beach and foreshore nourishment
  • Long-term multi-event modelling
  • Sorting and sediment transport in the swash zone 

Wave-structure interaction

  • Wave overtopping
  • Wave transmission
  • Wave reflection
 

Projects

We are involved in several research projects that aim at developing effective tools to design better coastal flood defences, and to understand the fundamental physical processes that occur on beaches. 

MORPHINE (Re-designing the coast: The Morphodynamics of Large Bodies of Sediment in a Macro-tidal Environment) 

In beach and shoreface nourishments large quantities of sand (the "nourishments") are deposited at strategic locations at and / or near to the coastline. These nourishments provide a source of sediment for beaches that are eroding, and, in the case of shoreface nourishments, they also shield the coast from high energy wave conditions whilst feeding sand to that section of coast. 

We have developed a new approach to understanding the dynamics of nourishments, in which the nourishment is considered a perturbation to the background system. This allows us to understand the nourishment dynamics, and therefore to predict the likely behaviour. 

Achieving this understanding allows us to better design these types of coastal defences such that they are more likely to achieve their purpose and to do so more cost efficiently


beach face evolution modelling


1D morphodynamical modelling of swash zone beach-face evolution

To investigate the complex beach face dynamics in the swash zone, a high accuracy numerical model has been developed, which demonstrates the evolution of a bed-step as wave backwash drains away.

In this project a high accuracy numerical model of a coupled system comprising shallow water equations and the Exner (sediment conservation) equation has been formulated. The model, after testing against analytical and previous numerical work, was used to investigate beach dynamics in the swash zone - the region of a beach periodically covered and uncovered by waves, as they encounter the shore. A bed-step was discovered to form, created mainly by the occurrence of a backwash bore.

The dynamics of these bed-steps has been investigated using different swash events. Bed shear stress has also been included in the model, and its effect investigated. Additionally, different sediment transport relations have been tested to examine their effect on these dynamics.

The numerical model is shown below as an animated sequence, with a solitary wave propagating toward and then breaking on a sandy beach (in yellow). The wave runs up the beach creating the so-called uprush, which then reverses - the backwash. In this process much sediment is transported landward and then seaward. At the beginning of the backwash a hydraulic jump is formed, on either side of which there are vastly different sediment transport rates. This leads to the creation of the aforementioned bed-step, a commonly observed beach feature at the seaward end of the swash zone.

beach face evolution modelling

Numerical modelling of the process by which a beach step is created by the
impingement of a solitary wave on an erodible (sandy) beach. Note that the red dot denotes the shoreline position, which on the backwash is immobile, because friction at the sand-water interface yields a vanishingly thin film of water on the beach-face. The colour bar shows volumetric sediment concentration (volume of sediment per unit volume of fluid and sediment). Both bed load and suspended load are included, and bed changes are fully coupled to flow. (Animation courtesy of Dr Fangfang Zhu).


flood scenario modelling

Flood MEMORY (Multi-Event Modelling Of Risk & recoverY)

The project looks at the most critical flood scenarios caused by extreme weather events striking vulnerable systems of flood defences and analyses how they behave during these events.

This is a collaborative EPSRC funded project involving ten universities in the United Kingdom. It looks at the most critical flood scenarios caused by sequences or clusters of extreme weather events striking vulnerable systems of flood defences, urban areas, communities and businesses. The CoDEg team is looking at how engineered defences behave during storms. Of particular interest is the effect of previous storms and floods moving sediment (i.e. shingle, sand and river bed material) so that the beach is in a different (perhaps weaker) condition when a second event arrives. In order to do this two state-of-the-art models are used in cascade (Delft3D and XBeach) to simulate the hydro- and morphodynamics of the system and analyse the behaviour of it together with the coastal defence during storms, and also, calculate and analyse the overtopping of the structure due to the extreme wave conditions.

The methodology followed in this research project is as follows. Wave boundary conditions (waves, tides and winds) obtained from the MetOffice and the National Oceanography Centre operational numerical models are fed to Deltf3D model. Then tides, waves and winds at the offshore of the Xbeach domain, given by the Deltf3D run, are inputted to Xbeach to simulate and analyse the hydro- and morphodynamic behaviour of the entire system during the selected storm. From the outputs of Xbeach a statistical analysis is performed to determine the overtopping probability of the structure and then generate the fragility curves of the structure.


flood scenario modelling


Results for a 6 days (144 hrs) long storm striking the system. Top-left panel: Sefton bathymetry indicating the location of the defence structure (magenta line) and showing the zoom at which the bed change behaviour is shown in the top-right panel. Low-right panel: Significant wave height and wave direction of the storm event striking the system. Low-right panel: Wave height behaviour of the system.

Project poster, description of figures: (a) The methodology applied in the project; (b) Sefton bathymetry with both, the Delft3D and Xbeach domains; (c) Preliminary erosion/accretion patters in the system near the structure after a storm has acted on the domain. Thick solid red line indicates de position of the toe of the structure and the thick solid black line is the location of the z = 0 metres contour.


sediment sorting and transport in the swash zone

Numerical modelling of the sorting and transport of non-uniform sediments in the swash zone

A numerical model based in the shallow water equations and the active layer theory was developed to investigate the transport and sorting of sediments and the resulting beachface evolution in the swash zone of a beach.

A numerical model was devised to describe the behaviour of two different grain fractions in the swash region (something often observable on relatively steep beaches worldwide). The theory used is the so-called active layer theory, heretofore used in river flow and other contexts but not in the swash. The model utilised a shallow water system of equations to model the flow, and a two-equation system to simulated grain fraction changes and bed change. The system was not fully coupled so there was no feedback onto the flow. Results indicated qualitatively plausible behaviour for the grain fractions under different extremes of swash events (non-breaking and collapsing). Different initial distributions of grain fraction were examined, and the effect of several waves also investigated. The numerical modelling approach, highly novel, was also shown to be correct when verified against a more conventional approach.

This poster summarises the project. In Figure 1.1a the different initial volume fractions conditions tested are depicted. Xs min is the minimum shoreline position, X s max is
the maximum shoreline position and Xm is the point at the middle of the swash excursion. In Figure 1.1b the sketches of the two different swash events modelled are presented, the breaking wave (energetic) and the non-breaking swash events. In Figure 1.1c The behaviour predicted by the model, in terms of fine volume fraction and bed change, for all the tests in the case of the breaking wave swash event are presented. In a similar way, in Figure 1.1d the results from the model in terms of fine volume fraction behaviour and bed change for the non-breaking wave swash are shown.

Detailed description of figures in the poster: (a) Initial volume fraction conditions;
(b) Breaking and non-breaking swash events; (c) Results of the model (fine volume fraction and bed change) for the breaking wave swash; and (d) Results of the model (fine volume fraction and bed change) for the non-breaking wave swash. Note that the blue and green circles are the limits of the swash zone.


modelling wave breaking in the swash zone

Numerical modelling of wave breaking in the surf zone

A numerical model has been developed, to predict the evolution of the velocity field and free surface elevation of a breaking wave propagating towards the coast.

Boussinesq-type equations are employed in a one-dimensional model to simulate the propagation of water waves towards the shore. Although this provides a good description of dispersivity at the coast, turbulent flow during breaking is not well represented without further treatment. In order to enhance the description of the surf zone, vorticity is injected by defining a 'roller' region under breaking waves. The rotation introduced here improves the description of energy dissipation in the model.

The use of a roller also allows depth variations in flow velocity to be resolved, providing a more complete view of the behaviour in this area. The removal of energy from the system leads to the decay in wave height seen in physical observations of wave breaking.

modelling wave breaking in the swash zone

Results generated by the numerical model for a wave propagating over a slope (shown in brown). Velocities are indicated by the colour bar, with the roller region indicated in grey
(Animation courtesy of Ben Tatlock).

Several test cases are used to evaluate the performance of the model, with laboratory data used to assess the accuracy of the results. The surface profile and velocity field predicted by the model for one such case is presented above. The formation of a roller can be seen, and the resulting reduction in wave height is demonstrated.


wave overtopping analysis

Analysis of the uncertainty in the prediction of wave overtopping at coastal structures

Numerical models can be used to predict wave overtopping. However, an infinite number of incoming wave time series can be reconstructed from the single wave energy density spectra usually provided. This introduces an epistemic uncertainty which this work will quantify.

This work examines the variability of wave overtopping parameters predicted by numerical models based on non-linear shallow water equations, due to the boundary conditions obtained from wave energy density spectra.

This variability is caused by the free surface elevation time series at the boundary being generated using the principle of linear superposition of spectral components. The component phases are then assumed to be random, making it possible to generate an infinite number of offshore boundary conditions from a single spectrum.

Numerical simulations of reference laboratory tests were carried out. Initial numerical tests consisted of inputting a measured free surface elevation at the toe of a structure during physical modelling, and comparing the resulting individual overtopping volumes. This showed very good agreement between the numerical prediction, the available empirical methods and the overtopping measurements.

A second set of numerical tests was carried out to examine the variability,achieved using measured incident energy density spectra at the toe of the structure, to generate a population of reconstructed offshore boundary time series for each wave condition tested, based on the principle of linear superposition.

An initial seed value is required to generate a population of uniformly distributed random phases. This was obtained using the Monte Carlo technique by varying this value for each simulation. For each wave condition, 500 different time series were generated,allowing a statistical analysis of the results.

Results showed that the variability in the predicted parameters is higher for the smaller number of overtopping waves in the modelled range and decreases significantly as overtopping becomes more frequent. The characteristics of the distributions of the predictions have been studied. The average value of the three parameters has been compared with the measurements. Although the accuracy is lower than that achieved by the model when the measured time series are used at the boundary, the prediction is still fairly accurate, above all for the highest overtopping discharges.

Results indicate that when the probability of overtopping is smaller than 5%, a sensitivity analysis on the seeding of the offshore boundary conditions is recommended.

wave overtopping analysis

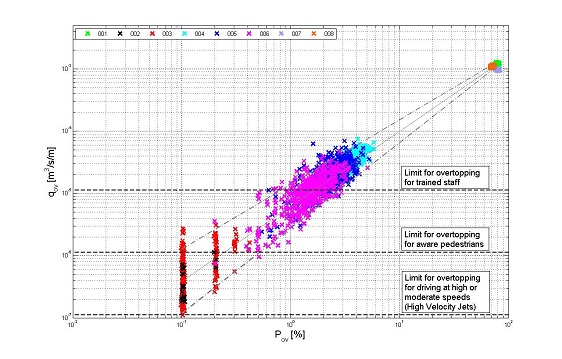
Logarithmic graph showing the correlation between probability of overtopping (Pov,num) and overtopping discharge (qov). Black horizontal dashed lines: overtopping limits from Pullen et al (2007). Solid grey line: trend line of the average qov. Grey dash-dot lines: 95% confidence interval for qov.

Reference: Pullen, T., Allsop, N., Bruce, T., Kortenhaus, A., Schüttrumpf, H., van der Meer, J., 2007. EurOtop - Wave Overtopping of Sea Defences and Related Structures Assessment Manual. Environment Agency, UK.


simulating evolution of the swash zone

1D medium-term simulation of the morphodynamical evolution of the swash zone through a fully-coupled efficient numerical solver

The prediction of the evolution of beaches caused by a multiple swash event is a highly desired information and still a challenging research field. This project aims to develop an efficient and reliable numerical solver to simulate medium-term beach face evolution.

In this project the physical problem related to the impact of a series of regular waves on an erodible (sandy) beach is studied, as a test case for real storm events.

The model consists of the Non-Linear Shallow Water Equations and the Exner equation for the hydrodynamic and the sediment transport modelling respectively.

The above mentioned equations are solved through a shock-capturing numerical scheme which strikes a balance between computational efficiency and result accuracy.

A key feature of the adopted solver is the fully-coupled approach, i.e. the simultaneous solution of the equations, which provides us with a detailed infrawave knowledge of the morphodynamic process. This is apparent in the animation below, where the top panel shows a series of wave impacts on a sandy beach while the bottom panel displays the instantaneous local values of the sediment transport flux, that is information of the amount of sediment carried by water and of which direction it is moving to (landward or seaward).

simulating evolution of the swash zone

 Results for a multiple swash event on an erodible beach. Top panel: water surface η and bed profile zb evolution (water region in blue, sediment-sand region in yellow). Bottom panel: instantaneous local values of the sediment transport flux qs (in red when seaward directed, i.e. negative, in yellow when landward directed, i.e. positive).


Coastal Dynamics and Engineering Research Team

Faculty of Engineering
The University of Nottingham
University Park
Nottingham, NG7 2RD


email: nicholas.dodd@nottingham.ac.uk