This page contains some examples of visualisations I have produced during various projects, shown in order of increasing complexity or interactivity. I have tried to indicate the context in which they were shown, and the data and software used. If you are interested in any of these techniques or projects, please email me at gary.priestnall@nottingham.ac.uk.
Photo Montage
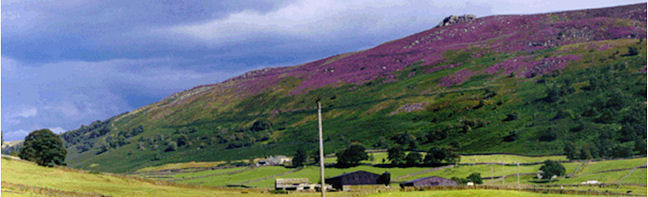
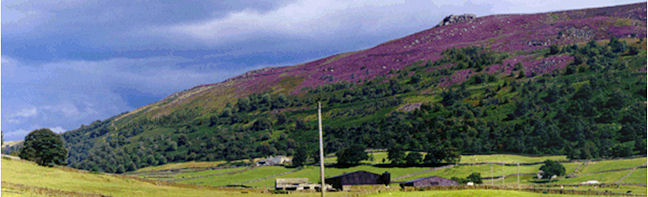
Used in landscape planning discussions in the Yorkshire Dales National Park, a before and after photo montage was produced using detailed re-planting strategy plans. In this case photo-realism was more important than the abaility to interact with the scene, so the production of a digital landscape model was not necessary, and would not have produced acceptable levels of photo-realism.
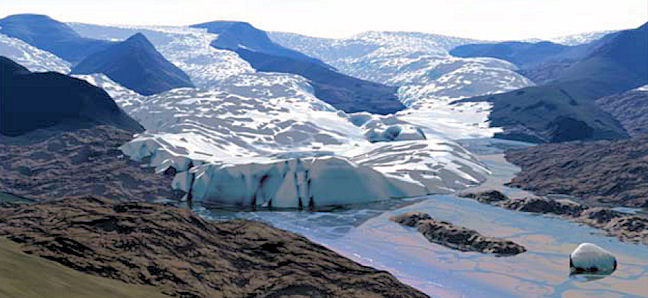
After visualising Digital Terrain Models (DTMs) in the context of quarrying and forest management, I began to apply these techniques in the context of fieldwork, both to assess the quality and usefulness of DTMs, and then as a way to showing reconstructions of glaciations in their landscape context. Field exercises began in Snowdonia in 1996 and moved to Cumbria in 2003. The image below shows one possible scenario for glacial retreat in the Newlands Valley in Cumbria. It was based upon ice contours digitised within ArcGIS, interpolated into a surface, and exported to the Bryce 3D modelling package via a CAD mesh. The reconstruction used documentation of the late Devensian glaciation, around 15,000 years before present (for example Fretwell et al, 2007) as a guide, along with examples of reconstructions of glacier ice surfaces in other parts of Cumbria by Evans (1997). For the purposes of this exercise a snout location mid-retreat up the Newlands valley was chosen, and the distribution of glacial till deposits shown on the geology map was used as a starting point for the footprint of the base of the glacier. With the present day elevation data being available in the form of the NEXTmap DSM, ice contours were estimated based upon observations of contemporary glaciers, following typical patterns as documented by Carr and Coleman (2007). Once in Bryce, a single pass of an erosion filter was applied to the surface mesh to add morphological texture, and a 'roche and ice' image texture map applied, which used alternative colours according to the slope and curvature of the surface.
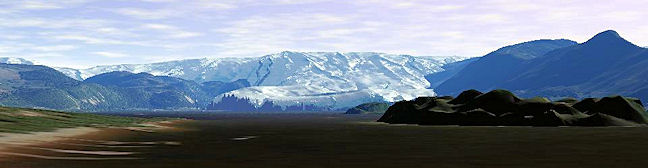
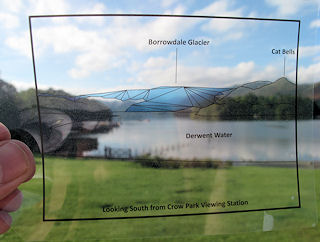
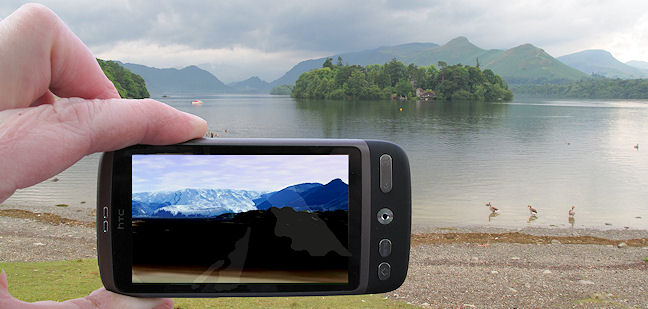
A similar reconstruction for the neighbouring valley of Borrowdale is shown below, looking South from the 'viewing station' of Crow Park on the SW edge of Keswick. This image is one of a series used more recently to provide content for field exercises using mobile devices to delivery visualisations of past landscapes out in the field, using various techniques foraugmenting the visitor experience.
During the Snowdon fieldtrips I began to use 3D modelling packages in the field centre to allow students to create their own perspective landscape views, which were then printed onto paper and also acetates, to enable the students to view the images later from their equivalent locations in the field. The examples below show several styles of acetate, based around the image above, experimenting with different levels of graphical content. These were produced with the additional application of locative media on mobile devices in mind (see later), where screen size and visibility mean that the photo-realistic detail of the above image would be difficult to make out.
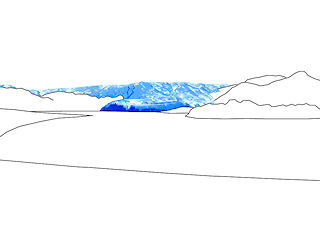
Selective representation - showing only the past landscape element (the glacier) with some visual reference data (the horizon and shoreline).
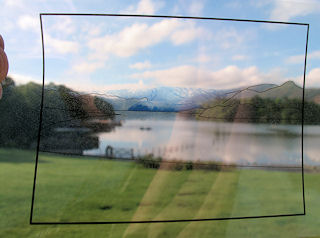
The image on the left as viewed throuigh an acetate in the field.
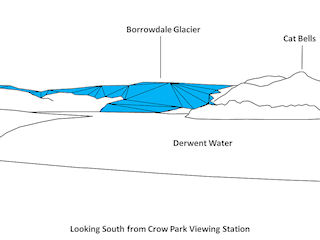
The detail of photorealistic representations are difficult to appreciate in the field, and the size and geographical extent of past features may be more important than colours and textures. For these reasons a more schematised mesh was used.
As can be seen above, this style of representation is more effective when trying to communicate the general size, position and extent of past landscape features.
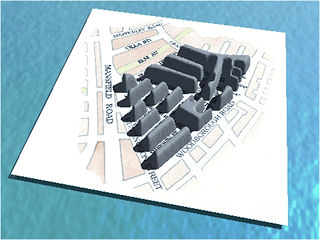
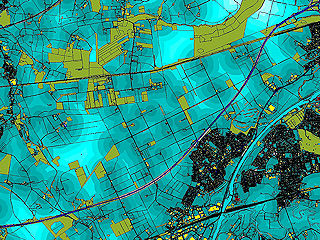
Some alternative static graphical techniques have been used in some circumatances, including a more abstracted representation of urban forms (below left), and GIS-based imagery resulting from an analysis of proximity to dwellings (below right).
Produced during the Real World Mapping project, to communicate broad changes through time of the urban structure of one part of Nottingham. This was integrated with other multimedia elements relating to community recollections of that place and shown during public displays and distributed via CD-ROM.
Produced during the Chat Moss project, this image was one of many produced as part of a project colloquium, where artists, map makers, and geographers came together to discuss representation of landscape.
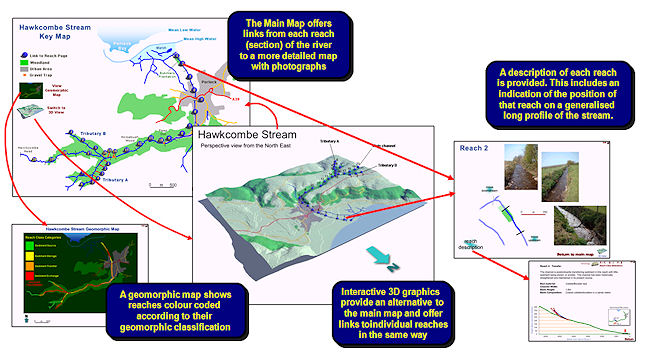
Any combination of 3D representations, maps, or diagrams, at a range of scales, can be integrated together into an interactive map, which can be distributed and run from CD or made for the web. I have used Macromedia Director to create a number of interactive maps for various purposes, including the Hawkcombe map below, which was used both as the appendix to a Fluvial Audit produced for the Environment Agency (by Colin Thorne and Kevin Skinner), but also as an educational tool capable of complementing lectures on river channel management.
[Back to the top]Locative media (visualisations triggered automatically in the field on GPS-enabled mobile devices)
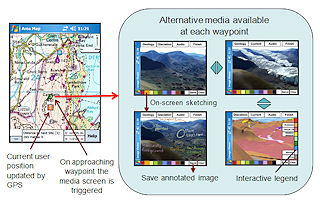
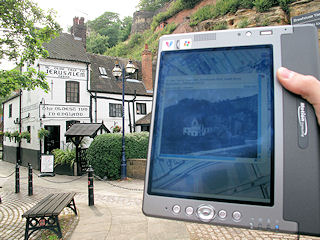
In 2005, in part throuigh developments made possible via the SPLINT project, we began to incorporate mobile devices into fieldwork, to experiment with using them as tools to augment the real world scene, but also to explore their field logging capabilities (such as sketching on screen). An example of a custom application was GeoMole, summarised below left, which allowed sets of images to be uploaded to a PDA and triggered when the user approached those points in the field. It also allowed on screen sketching and played audio descriptions of landscape features visible to the user, see PDF for more. We also used Mscape which made it easy to created different sizes and shapes of trigger zones on a map, drag media to these, and test out the mediascape in the field (below right).
GeoMole
MScape
The various graphical representations of glacial reconstruction, as shown earlier with the acetates, are being used on mobile devices to evaluate which type of representation is most easily visible on screen, an example is shown below.
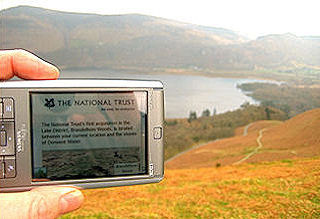
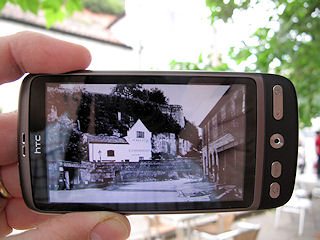
Similar techniques were explored during 2010 through the Digital Community History pilot project, where photos from the Picture the Past database were displayed from the locations where they were thought to have been taken from.
Geo-located historical photograph automatically displayed as the user enters a pre-defined trigger zone.
The user's location is displayed on an historical map until one of the photograph points is reached.
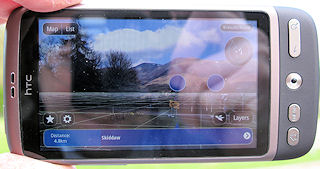
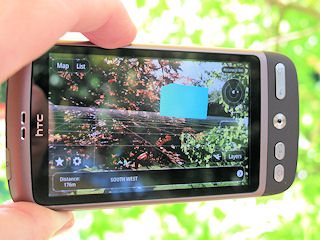
True Augmented Reality overlays computer-generated information over a real scene accurately, matching the virtual geometry of objects with the equivalent objects in the real world, as faithfully as possible (see Tinmith project). Many applications are emerging on mobile devices which have both GPS and digital compass, which overlay symbols or simple objects over the real scene via the camera view, for example Wikitude and Layar. During the 2010 "Mobile and Field GIS" module we asked students to evaluate Layar (below right) using the off the shelf data layers such as the mountain peaks data set shown. For the 2011 fieldtrip project I am exploring the use of use defined layers including 3D object layers (early trial below right), with a view to then indlucing simplified glacier models of the type shown in the acetate examples earlier.
The LAYAR Augmented Reality broswer, being tested before fieldwork in March 2010, here displaying icons aligned with mountain peaks.
Testing the use of 3D objects placed in LAYAR via the Hopalla development interface in August 2010, here a blue cube is placed at the desired position, orientation and size.
Movie sequences recorded along pre-defined flight paths have worked succesfully in some cases, where broad spatial distributions need to be communicated, but where interactivity either isn't needed or where it may lead to confusion if displayed in a public context.
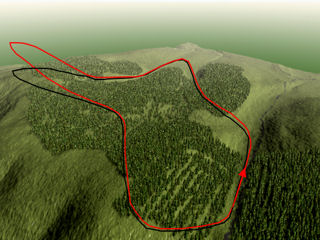
Fly-through around Clywd Forest, an early example using a DTM and trees 'seeded' via a land cover map, here rendered in Vistapro (produced around 1995).
The flight path displayed for context.
More recently Google Earth has proved a useful platform to author virtual tours, with additional surface objects being added via SketchUp. Below are two similar examples produced for the Wordsworth Trust. The first was designed to play as a video loop within the Trust's exhibition space during the summer of 2009 (more), the second as a promotional 'taster' for an exhibition of paintings running from summer 2010 (more). In both cases virtual billboards were created as a technique for placing images into 3D space in a controlled way, a technique that could be used for any kind of virtual signposting if required (Priestnall and Cowton, 2009).
Lear
Savage
Sometimes it is appropriate to keep the camera position still but animate objects within the scene, for example changes to the land surface such as a landslip (below, left) or simulating changes through time such as a future re-planting strategy (below, right). These two videos formed part of a series of ten made for the educational outreach requirements of the land managers of the Bolton Abbey estate in North Yorkshire, produced in Bryce in 2000. An ambitious new planting scheme included stages relating to past landscape states, and they wished to describe some elements of the history and formation of the valley, acting as pre-visit educational tools.
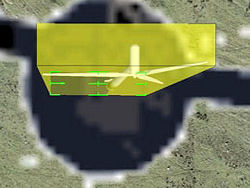
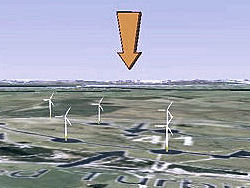
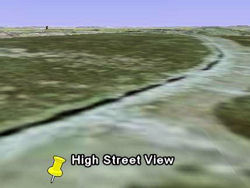
Clearly the power of Google Earth lies in its ability to be highly interactive, easily accessible, and to allow user-generated information, including 3D models, to be placed on the virtual Earth surface and shared with others. I have created several teaching practicals which introduce these techniques, the example below allows students to build a wind farm proposed for development, and compare views onto this development from popular walking routes, with the visual impact described in the planning documents available on the web..
Placing Collada models in Google Earth using image overlay of planning application
Wind farm model with orientation device placed at a known height above
Perspective view from ground level Point of Interest looking towards wind farm
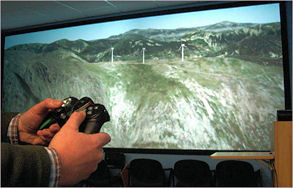
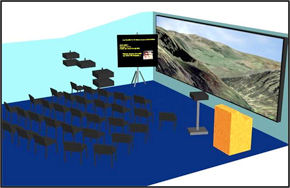
Through the SPLINT project we were able to introduce stereo 3D visualisation into teaching and learning exercises. The SPLINT lab, shown below, features two pairs of data projectors creating a 5m x 2.5m image, rendering virtual models in real-time using the Vega Prime software, viewable in stereo through the use of ‘passive’ eyewear. Each data projector required an image generator PC and a fifth PC was required to control the blending of the images across the large screen.
The lab was set up to transmit the user’s location in the virtual model, via Bluetooth as a GPS NMEA string, so any location-aware application running on a mobile device can be designed and tested in the lab before being taken out into the field. This information has also been used to implement a context map as used by many computer games, on a large monitor, where the users position and cone of vision is displayed over a map in real-time, as seen below.
[Back to the top]Field-based Virtual Reality
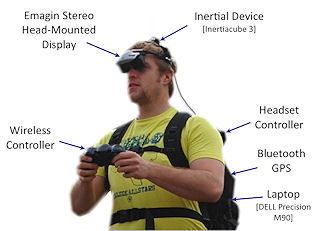
Through the SPLINT project we were involved with the design and testing of an experimental outdoor Virtual Reality system. I refer to it here a VR as the user's view was entirely computer-generated, although they were situated at the equivalent point in the real world landscape, therefore if the visor is flipped up they can see the real scene, which could be seen as a loose form of Augmented Reality. The technique used a real-time rendering engine developed by Virtalis, running on a DELL M90 laptop, driving a stereo display of a virtual model of the area seen through the Head-Mounted Display (HMD). The position of the user within the virtual model is given by a Bluetooth GPS on the outside of the user's backpack, and the orientation within the model is determined in real-time by an inertial device on the user's head. The wireless gaming controller could be used to control various aspects of the display in the HMD via drop down menu bars, including zooming in and out. The HMD gave the user a stereo display of the virtual model covering most of the central field of vision. The components of this system can be seen below left, and are described in more detail in Jarvis et al (2008). The system can be seen in use in 2009 on the 'Mobile and Field GIS' field course below right.
Components of the field-based VR system
Video simulation of view through HMD as user looks around the landscape, here the Newlands valley in Cumbria.
Carr, S. and Coleman, C. (2007) An Improved Technique for the Reconstruction of Former Glacier Mass-Balance and Dynamics, Geomorphology 92, 79-79
Evans, I. S. 1997. Cirques and moraines of the Helvellyn range, Cumbria: Grisedale and Ullswater. In: Boardman, J. (ed.) Geomorphology of the Lake District: a Field Guide. British Geomorphological Research Group, Oxford, 63-87
Fretwell, P.T. et al (2007) The Last Glacial Maximum British-Irish Ice Sheet: a reconstruction using digital terrain mapping, Journal of Quaternary Science, 23, 241-248
Jarvis, C, Priestnall, G., Polmear, G. and Li., J (2008) Geo-contextualised visualisation for teaching and learning in the field Geographical Information Science Research UK (GISRUK) Conference, 2 - 4 April 2008, Manchester Metropolitan University [PDF]
Priestnall, G. and Cowton, J. (2009) Putting Landscape Drawings in their place: Virtual Tours in an Exhibition Context, Geospatial computing for the arts, humanities and cultural heritage workshop at the fifth IEEE e-Science conference, Oxford, UK, 9-11th December 2009 [see project website]