 What
factors do you think
determine the cluster size needed for nucleation (the critical cluster size)?
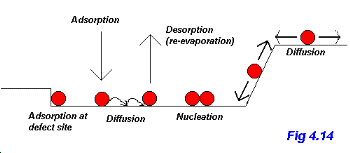 Having covered adsorption and diffusion in the previous sections we can now consider how these processes fit together in the extremely important (from both fundamental science and technological viewpoints) phenomenon of thin film growth.
The atomistic processes underlying thin film growth are shown in Fig. 4.14 (adapted from Chapter 1 (by J. A. Venables) of The Chemical Physics of Solid Surfaces, Vol. 8)
Atoms (we'll discuss nucleation and growth in terms of atoms but similar arguments apply for molecules) arrive from the vapour phase at the impingement rate, JI. An adsorbed atom can then either desorb (re-evaporate) or diffuse across the surface. The nucleation of an island can occur via one of two general mechanisms:
 What
factors do you think
determine the cluster size needed for nucleation (the critical cluster size)?
These processes can lead to the three very different forms of film growth shown schematically in Fig. 4.15.
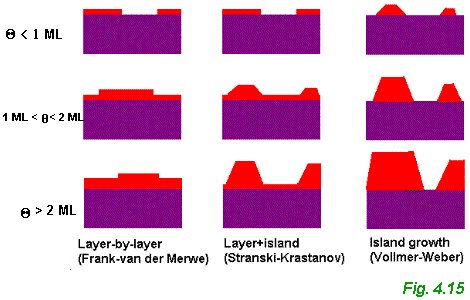
Simple thermodynamic arguments based on the relative magnitudes of the relevant surface tensions allow us to distinguish the conditions needed for each form of growth. ( However, there is a certain important proviso associated with these arguments – see below ). We take gS, gA and gI, as the surface tensions associated with the clean substrate surface, the adsorbate surface and the interface between the adsorbate and the substrate respectively. As first proposed by Bauer back in 1958 (see Luth, Chapter 3), the growth mode may be characterised by the parameter Dg which is given by:

Although this distinction of growth modes based on thermodynamic arguments explains the variety of behaviour depicted in Fig. 4.15, it is important to realise that film growth is a non-equilibrium, kinetic process. In thermodynamic equilibrium the rates of impingement and re-evaporation must be equal (i.e. the rates follow the principle of detailed balance: "in thermodynamic equilibrium the rate of any process that leads to a given state must equal exactly the rate of the inverse process that leads from that state" (Thermal Physics, Kittel & Kroemer, Chapter 14). Therefore, in equilibrium there would be no net growth of a film. The arguments given above assume thermodynamic equilibrium and thus are only really applicable for growth conditions which are close to equilibrium.
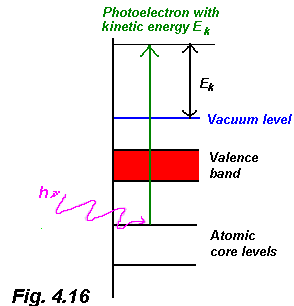 In x-ray photoelectron spectroscopy a monochromatic x-ray source is used to excite electrons from core electronic levels in a solid into the vacuum via the photoelectric effect. This process is shown schematically in Fig. 4.16 and we'll cover the underlying physics in some depth in Section 6. For now, however, just note that an electron excited from a particular core-level of a particular material will have a characteristic kinetic energy, EK, given by:

where hn is the photon energy, f is the work function and (EB+f) is the binding energy of the electron in the solid. Detecting the number of electrons ejected at various energies using an electron spectrometer (again, see Section 6) enables us to probe the chemical structure of a material and, under the correct conditions, probe the chemical properties of a surface or interface.
Electrons travelling through a solid have a characteristic mean free path which is dependent on their kinetic energy. For the electron energies typical of the majority of XPS experiments, the mean free path is of the order of a few monolayers – only electrons from the uppermost layers of the solid (i.e. the near surface and surface regions) contribute to the XPS signal. The XPS signal intensity that is measured depends on the magnitude of the electron mean free path and the amount of material the electrons need to penetrate. The decay in XPS signal as a function of material thickness is given by:

i.e.

or, writing z=nd where n is the number of monolayers and d is the thickness of a monolayer;

We can exploit this simple relationship to determine the growth mode of a particular adsorbate/substrate system. By monitoring the rate of decay of the XPS signal from the substrate and the rate of increase of the signal due to the adsorbate we can clearly distinguish the three growth modes (Frank-van der Merwe (FM), Vollmer-Weber (VW) and Stranski-Krastanov(SK)) discussed above.
In layer-by-layer (FM) growth, as each new monolayer is added, from 4.25 we expect an exponential decay of the substrate signal, Isub. Similarly, the intensity of the adsorbate signal, Iads will increase as:

where  is the signal intensity associated with a thick, bulk-like film of adsorbate.
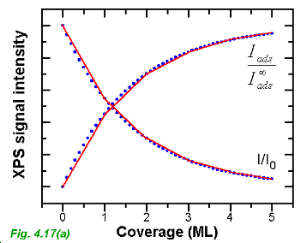
The XPS signal intensity vs coverage curves for the case of layer-by-layer growth are shown in Fig. 4.17 (a). Note that, as stressed by Luth, Chapter 3, Eqns 4.25 and 4.26 do not provide any information on submonolayer growth. During the growth of a monolayer the signal intensity will vary linearly with coverage and thus, the red curves (which consist of a number of linear segments of different slopes) in Fig. 4.17(a) are a more accurate description of the variation in signal intensity. The envelope of the red curve is the exponential curve shown in blue dots and given by Eqn. 4.25 (substrate) or Eqn 4.26 (adsorbate).
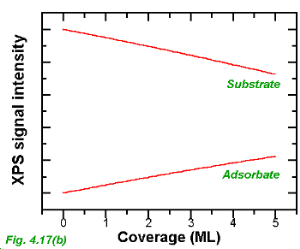
The form of the XPS signal intensity vs coverage curve for Vollmer-Weber (island) growth is markedly different, as shown in Fig. 4.17(b). In this case, large areas of the substrate remain clear of adsorbed material and the substrate and adsorbate signal intensities show a slow rate of decay and increase respectively. The exact rate of decay/increase will depend on the morphology of the adsorbate material i.e. the precise density and shapes of the islands.
Stranski-Krastanov growth falls midway between these two cases. Depending on the critical coverage, the XPS intensity vs coverage signals will consist of one or more linear segments followed by a slower decay/increase related to the formation and growth of islands.
NB It is not only XPS signals that may be used to determine growth modes. Auger electron spectroscopy (AES) (see Section 6) signals are also very commonly analysed in a very similar manner to that described above.