Spectroscopy Suite
Spectroscopic investigation of samples can yield invaluable information on material composition
Spectroscopy suite at a glance
Spectroscopy involves an interaction between light (electromagnetic radiation) and matter, including absorption, emission, scattering, reflection, refraction, resonance and diffraction. The electromagnetic spectrum has different regions beyond the visible spectrum which can be detected i.e. radiowave, microwave, infrared (IR), ultraviolet (UV), x-ray and gamma rays. Molecules behave differently when they interact with light from different regions of the electromagnetic spectrum. For example, electrons in molecules that absorb visible or UV light transition from lower to higher electronic energy levels, molecules that absorb microwaves rotate and those that absorb IR light vibrate at different energies. Thus, depending on the method and the source of electromagnetic waves, one can obtain information about the atoms, molecules, or crystal structure of a material.
Capabilities
- Compound identification i.e. based on fingerprint regions and databases
- Material characterisation (qualitative and quantitative)
- Monitoring of a chemical process
- Assessment of substance purity
- Measurement of the effect of electromagnetic radiation on a sample i.e. to determine intensity or duration of exposure
Typical Applications
- Biomedical applications (screening and diagnosis)
- Pharmaceutical analysis
- Life sciences, biologicals and forensics
- Environmental analysis
- Contaminant analysis
Image 1: Intrinsic Fluorescence and Chemical Denaturation of Proteins
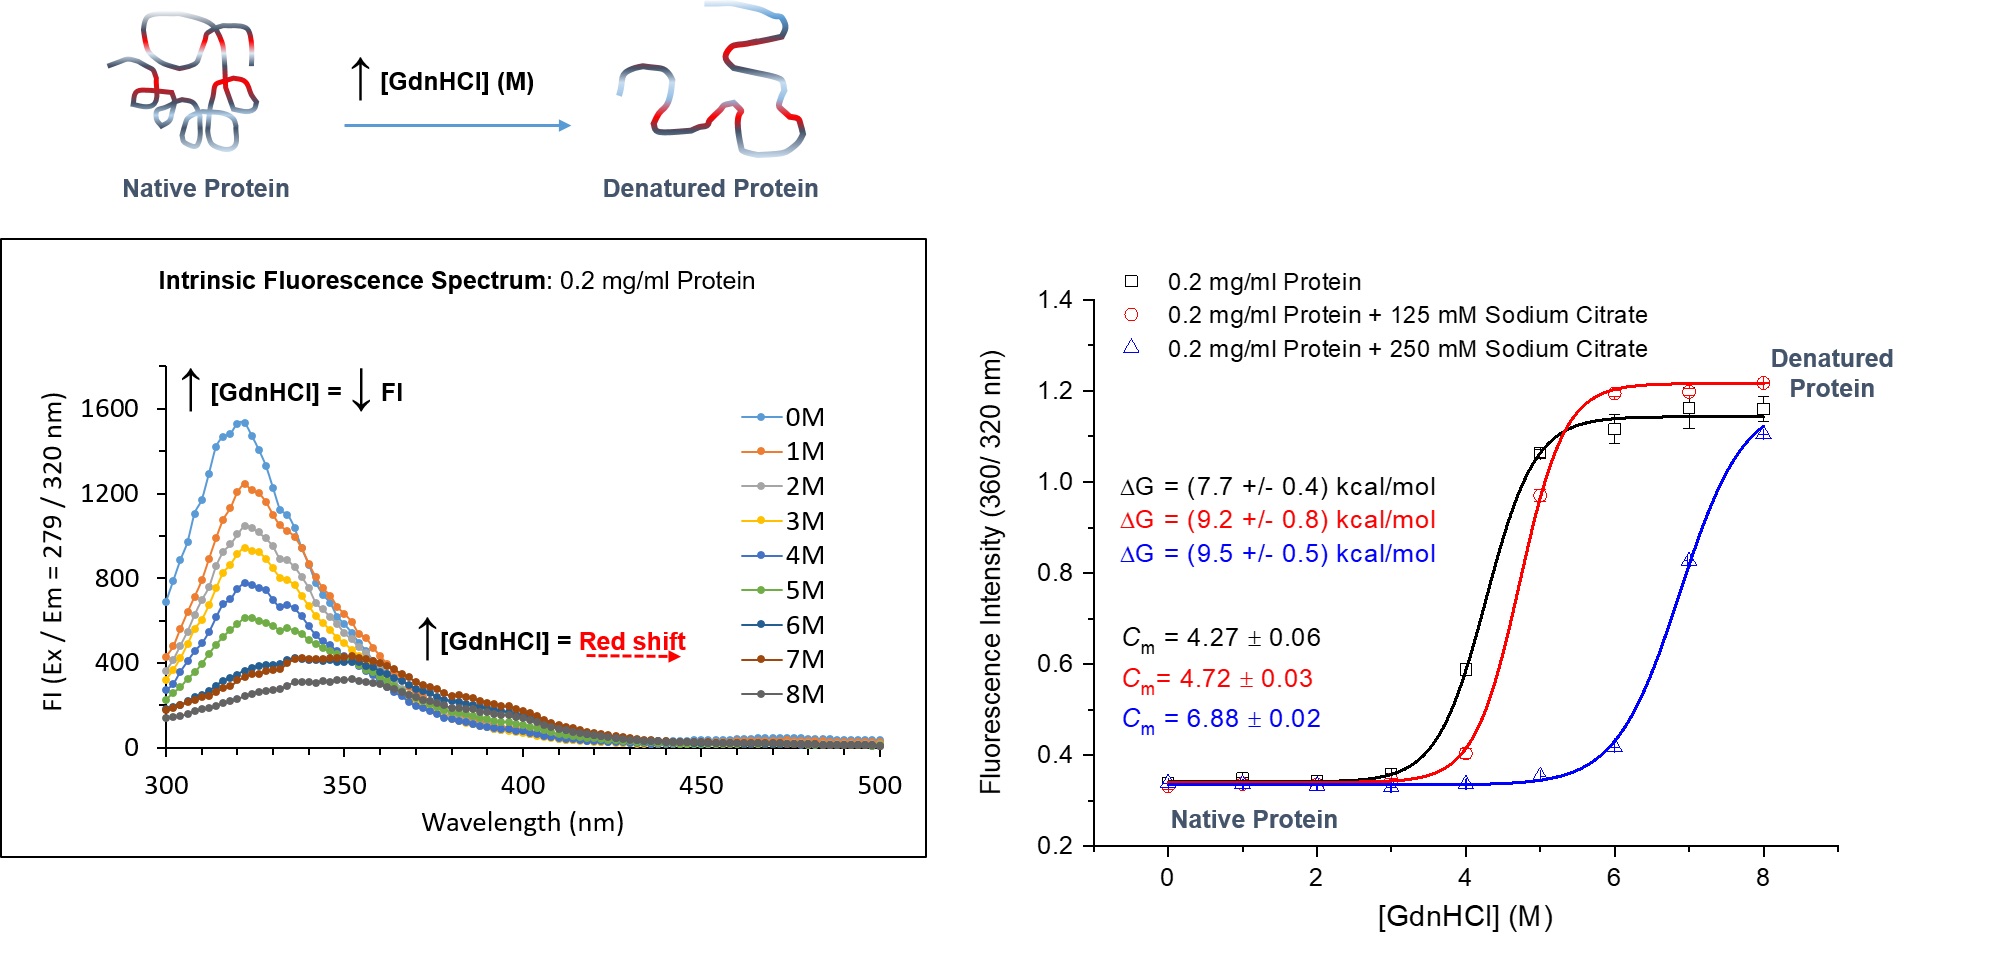 Intrinsic protein fluorescence spectroscopy can be used to probe chemical denaturation of proteins with and without additives. In the above example, the intrinsic fluorescence of a protein in the presence of increasing concentration of denaturant guanidine hydrochloride (GdnHCI), with and without additive sodium citrate (125 and 250mM) was measured using a TECAN Spark 10M. Fluorescence intensity (FI) scan spectra of protein only at varied GdnHCl concentrations is shown. Equilibrium unfolding curves were plotted from FI ratio (360/320nm) obtained from fluorescence scan spectra. This clearly depicted the equilibrium transition of the protein from native folded to unfolded denatured state with and without sodium citrate. Increasing the concentration of sodium citrate decelerated the unfolding of the protein in increasing concentrations of GdnHCl. The transition midpoints (Cm), where 50% of the protein is unfolded was determined from each denaturation curve. The apparent Gibbs free energy (Δ) of unfolding was also determined. Sodium citrate was clearly able to stabilise the protein.
Figure courtesy of Marion J. Limo, ISAC, School of Pharmacy, University of Nottingham
Image 2: Characterisation of Amphiphilic Star-shaped Block Copolymers
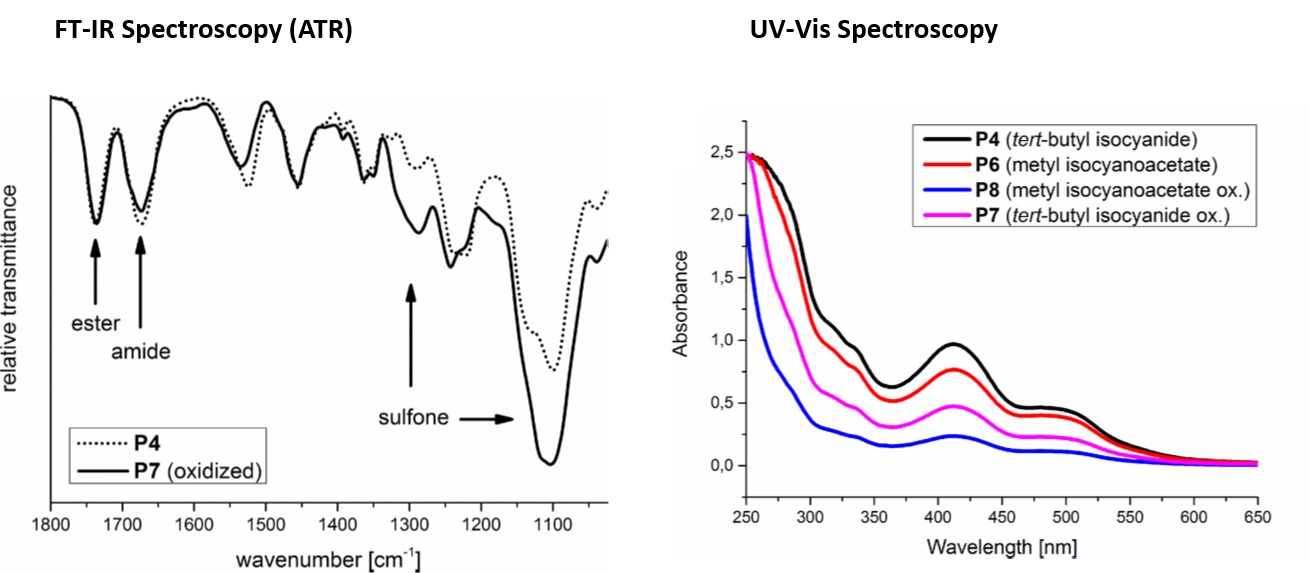
Spectroscopic methods are often used in combination to give complementary information. In one examplar study, amphiphilic star-shaped block copolymers with hydrophobic cores and hydrophilic coronae were synthesised as potential drug delivery systems using a Passerini three-component polymerization reaction (Passerini-3CR). Different isocyanides and core molecules were utilized for the syntheses of the amphilic star-shaped block copolymers and the polarity of the polymer chains was further tuned by oxidising their thioether groups to sulfones. FT-IR was used to confirm oxidation reactions and sulfoxide formation for example in the conversion of P4 (tert-butyl isocyanide) to P7 (tert-butyl isocyanide oxidised). Complete conversion inferred from FT-IR spectra was corroborated using results from proton nuclear magnetic resonance (1H NMR), another powerful and extensively used spectroscopy technique. The ability of the polymers to encapsulate different active molecules (Orange II, Para Red and azithromycin) was also examined. UV-Vis spectra of the encapsulation of one of these active molecules, water insoluble Para Red in water by reduced and oxidized star-shaped block copolymers P4, P6 (methyl isocyanoacetete), P7, and P8 (methyl isocyanoacetete oxidised) is shown. Its encapsulation was higher with nonoxidized star-shaped block copolymers with P4 and P6. Thus, the polarity of the polymers significantly affected encapsulation efficiency.
Image reproduced from Stefan Oelmann, Alessandra Travanut, Dennis Barther, Manuel Romero, Steven M. Howdle, Cameron Alexander, and Michael A. R. Meier. Biomacromolecules 2019, 90-101.
Our facilities:
Multifunction Platereader, TECAN Spark 10M
The SPARK 10M is an automated high throughput multimode microplate reader that can measure absorbance, fluorescence, time resolved fluorescence, fluorescence polarization and luminescence of biological and non-biological samples. It can also be used for cell based assays to determine cell number. It is suited for both endpoint and kinetic measurements.
FT-IR Spectrometer, Agilent Cary630
The Agilent Cary630 provides quantitative and qualitative information for routine FT-IR analysis of solids, liquids, and gases. It is designed for easy change of sampling accessories with no alignment required. The accessories available are: Transmission cell, DialPath and Attenuated Total Reflectance (ATR) with different sensors (Diamond, Germanium and Zinc Selenide). This allows one to choose the sampling method that best fits the pathlength required to give the highest quality results.
NanoDrop UV-Vis Spectrometer, ND2000
The NanoDrop™ 2000 is a full-spectrum (190 - 840nm) microvolume (measures as little as 0.5- 2µl sample volumes) UV-Vis spectrophotometer that is routinely used to quantify and assess purity of DNA, RNA and proteins with high accuracy and reproducibility. Its patented sampling design enables it to measure highly concentrated samples, up to 200 times more concentrated than samples measured using the standard cuvette.
Many more..
Including UV-Vis Spectrometers (Varian Cary50), fluorescence Spectrometers (Varian CaryEclipse and NanoDrop ND3300), Raman Spectrometer (SciAps ReporteR) as well as instruments hosted by the Nanoscale and Microscale Research Centre (nmRC) such as the Horiba LabRam HR Raman and Kratos Liquid Phase Photoelectron Spectroscopy Machine (LiPPS) XPS.