
Parallel Profiler: Jumpshot
A profiler for parallel code will inform the developer with more information on the message passing artefacts of ones source. An example serves as the best way to illustrate this. Copy /opt/score5.8.1/score-src/runtime/mpi/mpich-1.2.0/src/examples/basic/fpi.f to somewhere convenient. The issue
mpif77 -mpilog fpi.f
mpisub 3x2 a.out
This will generate a file called fpilog.clog which we need to convert
to SLOG format:
clog2slog fpilog.clog
Start the profiler:
logviewer fpilog.slog
An extra X window will now appear with a graph in it
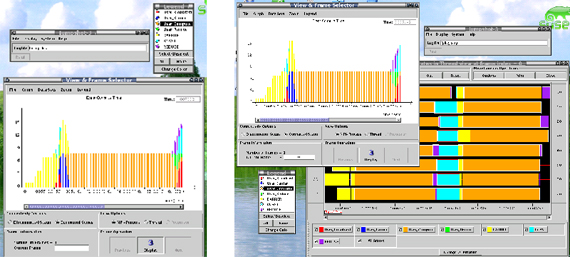
From this you can easily see how many calls each MPI call has made
and the time to do so. Clicking on DISPLAY will open a second windows
where the developer can see more timing statistics by clicking on
the bars themselves or clicking on the legend towards the bottom.